Analyzing W3C logs with Excel and PowerQuery
15 Years ago I wrote a .net WinForms tool called "IIS Log Viewer" to parse and visualize W3C log files in a nice color coded grid. Of course it topples over as soon as you analyze a file of some respectable size, so I'm sorry to say I abandoned maintenance of the program. Only today I realize I should have called it "W3C Log Viewer", but here's to hindsight. 🤣🍻
Today I use a different approach with Excel and PowerQuery instead. In this article I'll show how you can anlyze a fair amount of traffic (at least a million requests) from several logfiles possibly spanning your entire retention period. I'm a Microsoft fanboy, so I'll show how to do it with Azure App Services logging to Azure Storage accounts, but you can point to filesystem folders as well.
Setting up W3C logging on an Azure App Service
The nicest way of HTTP logging I know of on Azure is by logging to storage. It'll persist across slots when you swap, and you won't have to download them to analyze them.
You'll find the settings you want under Monitoring\App Service Logs:
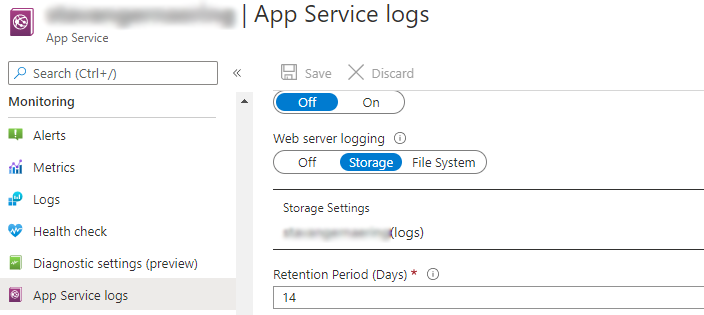
Now, you'll production slot will happily rotate n days of logs in your storage account. They'll be stored in a hierarchy by slot name (?), year, month, date and finally hour. Totally horrible to analyze without a tool, but we got just the one! Also too difficult to screenshot, so you'll have to imagine it. 😇
Getting data into Excel
I believe PowerQuery really made it's break into Excel in the 2016 version. We'd had some "Power" tools (pivot?) from 2013, but this version really hit the target! I can't get over the fact I waited until 2020 to get more acquainted with it.
In the old versions, we more or less only had the horrible text import / split column wizard. In newer versions of Excel we've got a super rich "Get & Transform Data" section in the Data ribbon, not to speak of (almost) the full power of PowerQuery behind the scenes.
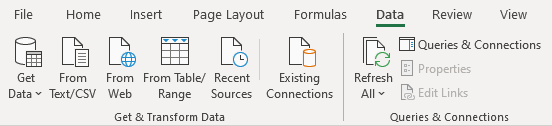
The "new" Excel data ribbon
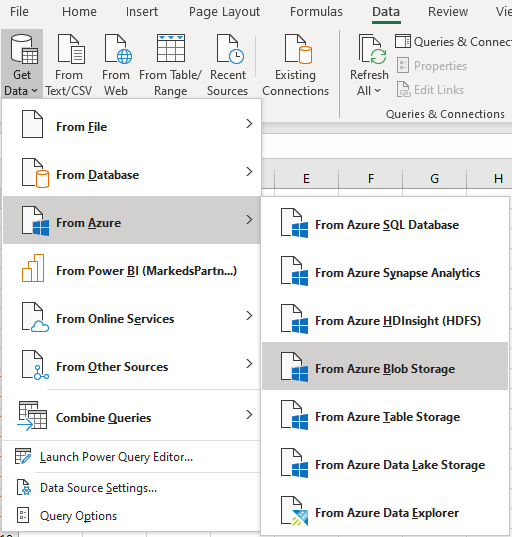
I particularly like the "From Web" one, since it'll handle most modern formats such as JSON and XML. (Even CSV)
However, for our purposes, we'll find our source of choice by drilling into the "Get Data" dropdown:
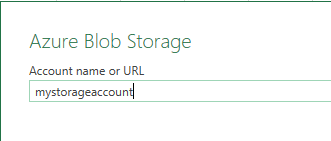
We go on to enter our storage account name:
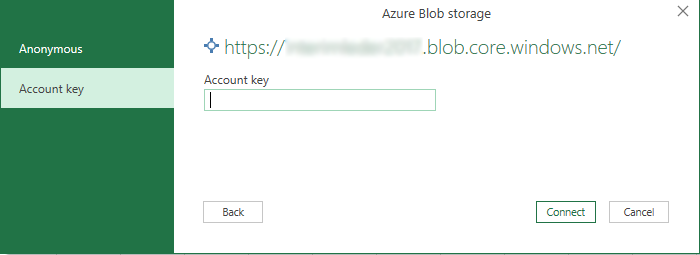
Then you'll need to find your account key and enter it in order to authorize with Azure:
Mind the security concerns and the data firewall when authenticating sources and sharing connected Excel files.
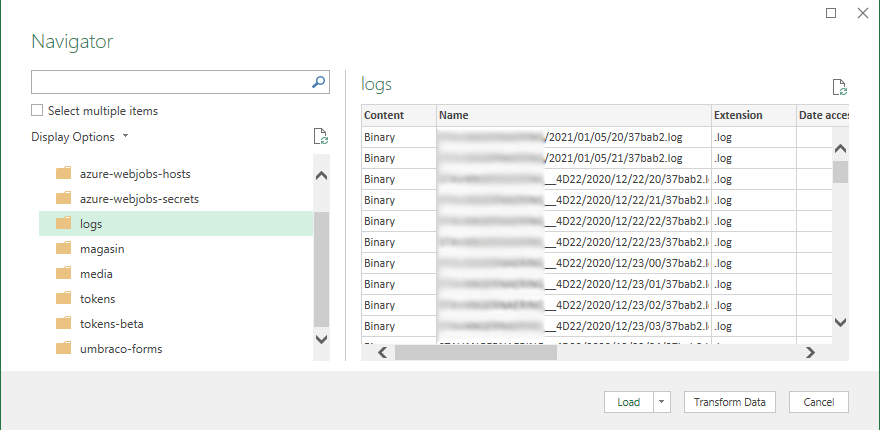
The next "wizard" we're faced with is a blob storage browser. We'll select the "logs" container, but leave it at that. We want to "load and transform" all the blobs we see on the right hand side.
So the final step is to resist the urge to click "Load", but rather click "Transform Data". This will launch the most powerful data transformation tool I know to date, the aptly named "PowerQuery" GUI.
Getting the contents of all the log files
Excel will immediately pop a new (sadly modal) window with a new Query aptly called "logs". The smiley up there is for sending feedback, but I like to think PowerQuery is just a happy place alltogether.
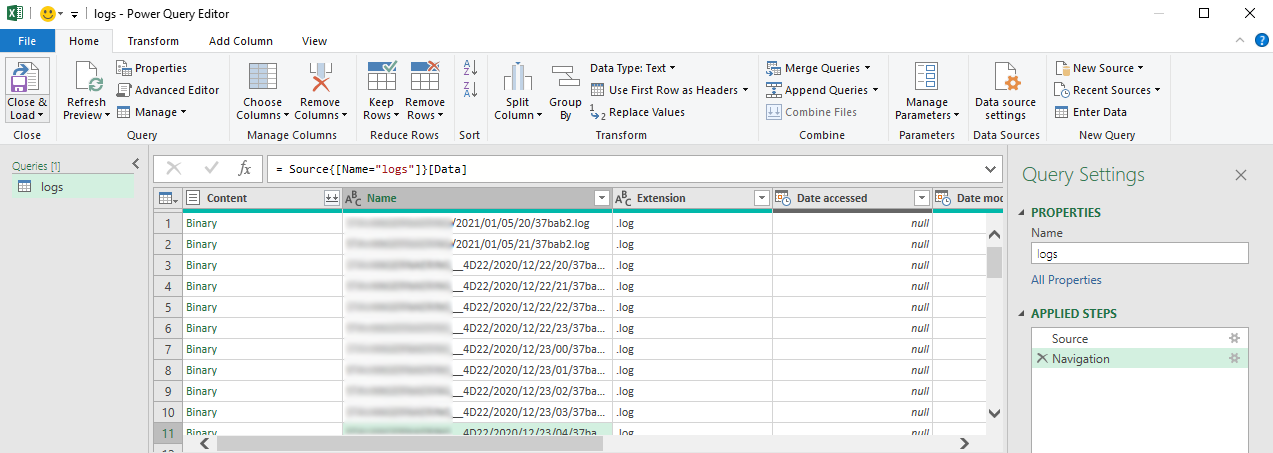
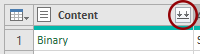
As you can see there's a bunch of options up top, but we're actually after a slightly more inconspicuous one down in the "Content" column header called "Combine files":
This will pop another dialog asking us about encoding and whether we want to skip things that bugs out. Also we can choose which file to use as our sample for further transformation:
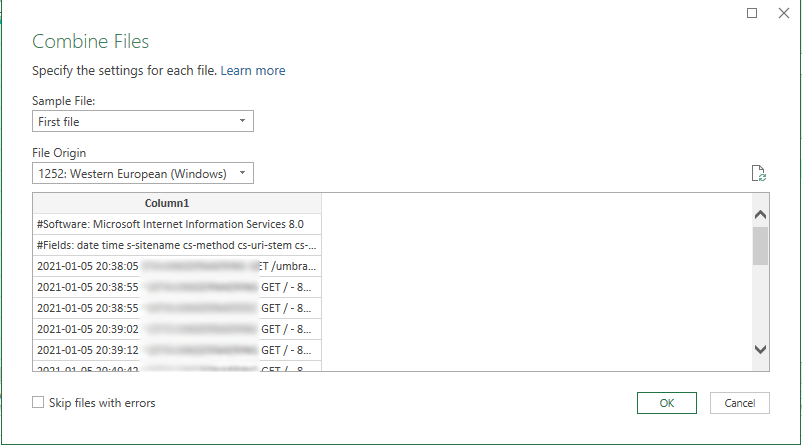
We'll go ahead and use the first one, since the sequence of those don't matter. The're all in the same format. What follows is this:
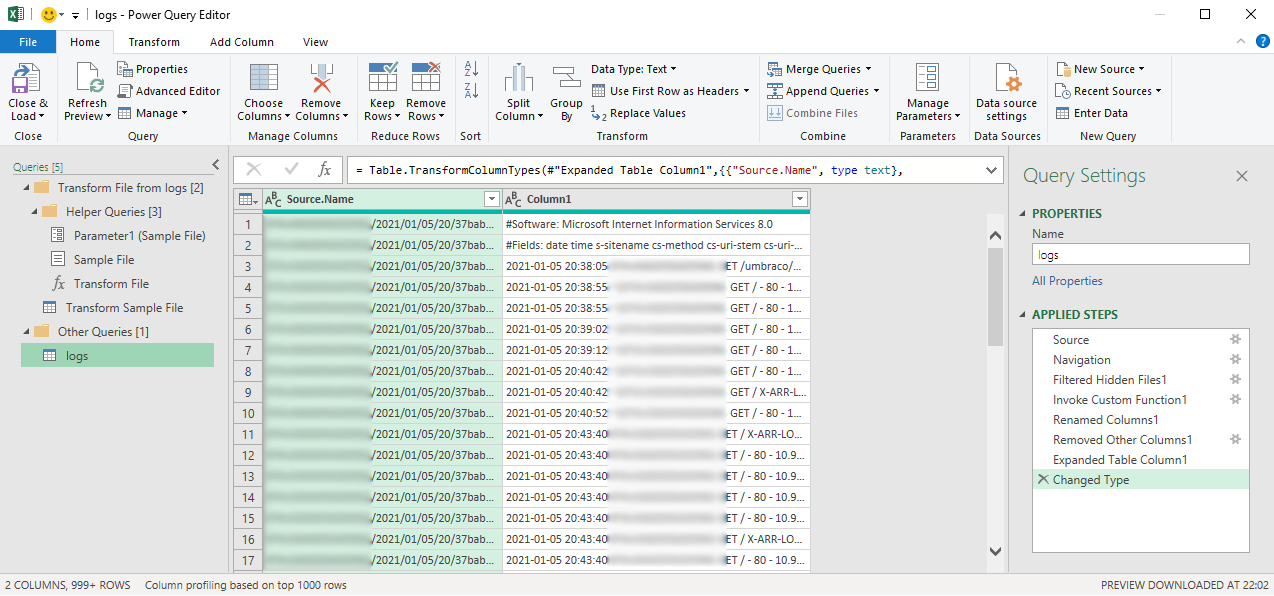
We're now faced with a fairly more complex set of queries and steps in our "logs" query. The inner workings of those are out of the scope of this post, but I promise there's magic to be had if you'll dive deeper. The .net peeps reading this will also appreciate the familiar form of static method calling in the "formula bar". PowerQuery is a delightful blend of familiar syntaxes. 😇
The more interesting thing however is that (very quickly) the blob file contents are shown in a new column called "Column1". This is our next target.
Transforming the data and preparing for analysis
Before we can make anything meaningful out of the actual log data we have to get rid of some junk, and figure out what fields we've logged. These are the first two lines of the logfile. Alas they've got a bit of junk attached. The first line is just garbage, so we'll employ our first secret weapon. Remove top rows: (it's on the Home ribbon)
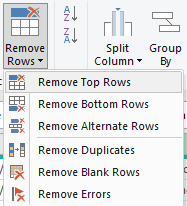
You'll be prompted with a dialog asking how many rows to remove. We want to remove the leading hash lines except the "#Fields" one. In my case, this is just the "#Software" row, so I remove 1 row.
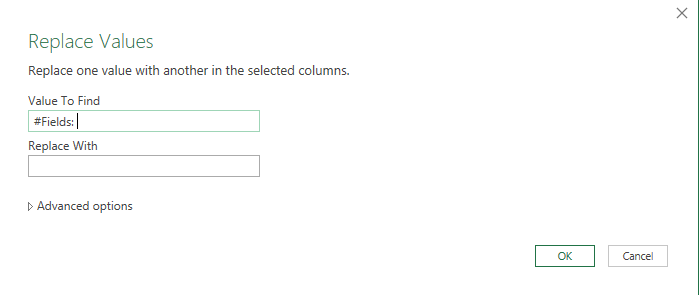
The next step is to remove the leading "#Fields: " text of the column header specification. We'll drag out our second weapon of choice, "Replace Values". For this step we need to select "Column1" and move over to the "Transform" ribbon. Here we'll find the "Replace Values" dropdown where we select the values option:
We're faced with (yet) another dialog in which we specify that we want to get rid of the "#Fields: " string: (make sure to include the space)
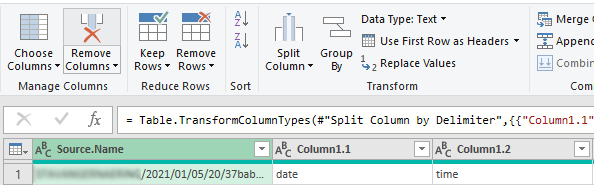
Splitting columns
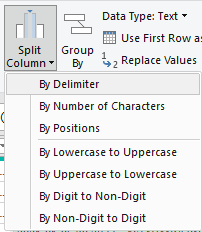
We're here! The good old "split column" phase is up!
Back at the home ribbon, we find our old friend "Split Column". For W3C log files we're dealing with space delimited files, so we go with the "by delimiter" option:
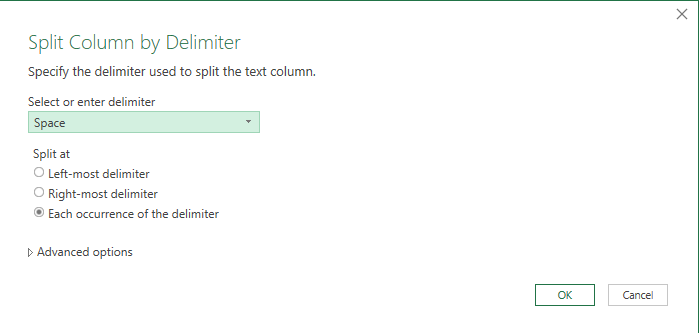
Yet another dialog where we specify space as the delimiter:
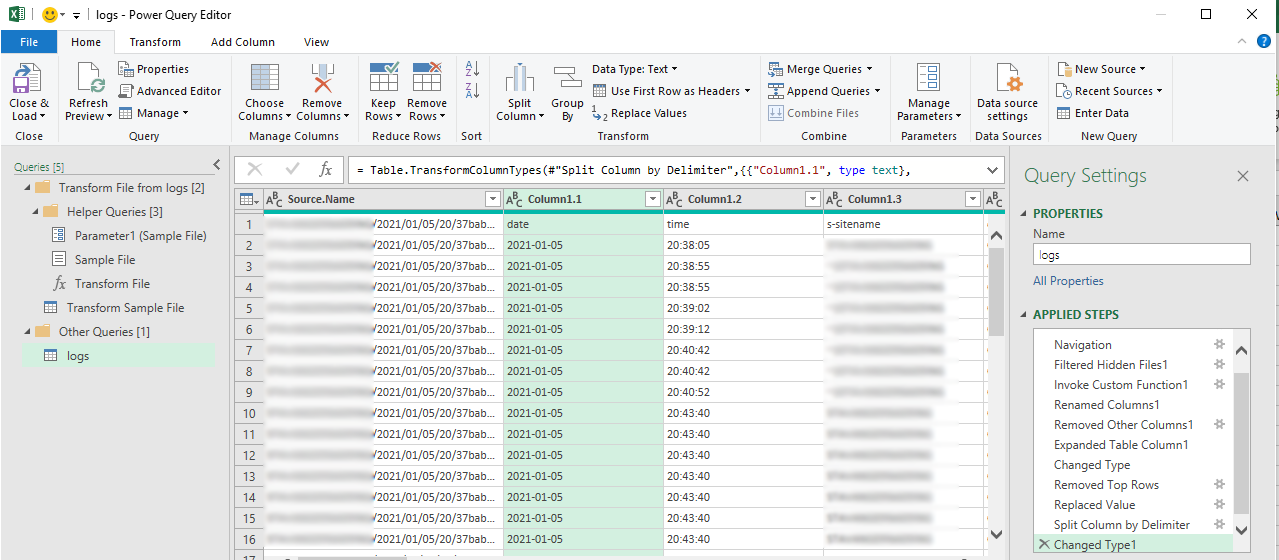
Now we're definitely getting somewhere:
Notice how we didn't have to specify any other options than how to split the data? No data types, no headers, nothing.
We do need to get those headers as column names, though. We're already on the home ribbon and if you've been looking closely you've likely noticed both "Remove Columns" and "Use First Row as Headers". We'll remove the now useless "Source.Name" column, and then use the first row as our headers:
Then we hit the "Use First Row as Headers" button, et voilá:
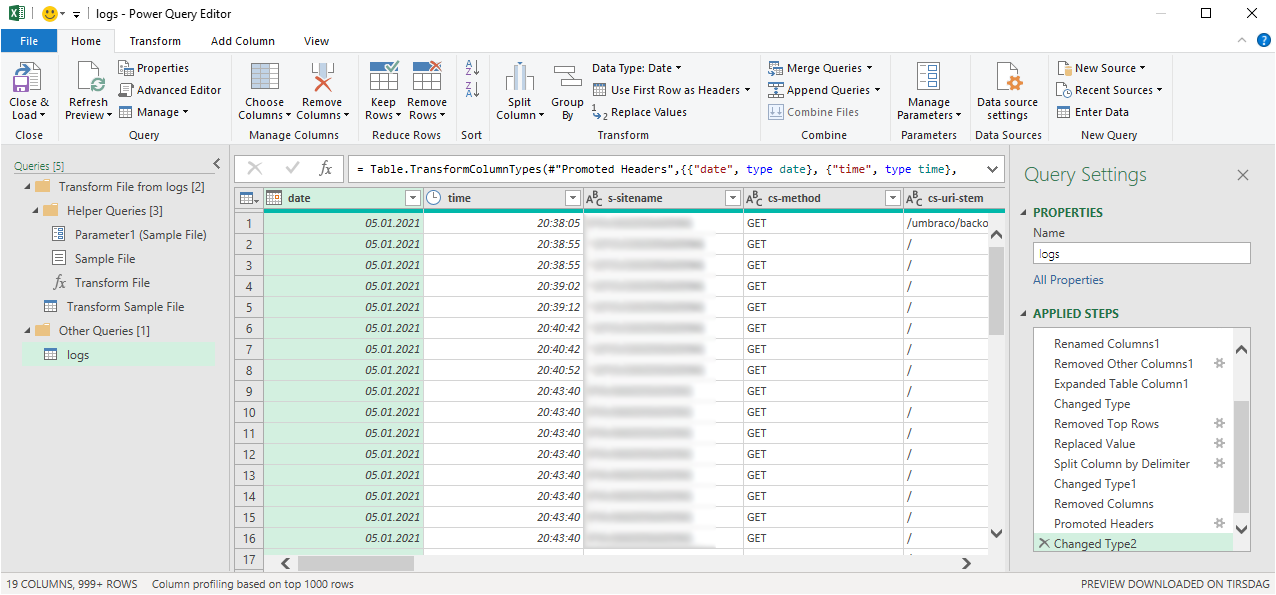
The utter sweetness (if you look in the bottom right corner) is that PowerQuery is awesome at guessing data types. Granted you have to nudge it a bit every now and then, but the date, times and numeric data is already properly typed.
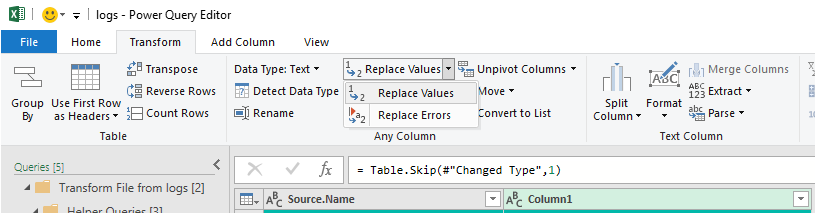
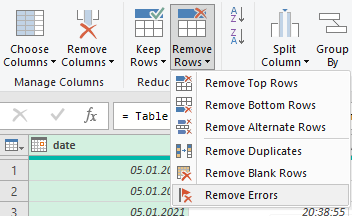
Which leads us to the last necessary step for this to work flawlessly. PowerQuery has only sampled 1000 rows from the first file. It's not aware that several more lines starting with a hash is awaiting further down the road. That's gonna mess up it's date conversion for the first column. Here's for our final trick, "Remove errors". It's an option under our old friend "Remove rows" on the home ribbon. Make sure to select the date column before you hit it:
And that should be it! We're ready to hit that captivating "Close & Load" button up in the left corner of the home bar. Go ahead! Hit it!

Now depending on whether you've got less than a mil. lines total in your log files this will succeed or fail. Despair not though, there are ways to get around it. I'll add some tips at the bottom.
If you're lucky enough to escape the Excel row limit trap (unlike some unfortunate brits recently), you'll be faced with a fancy green table after a while. The "Queries & Connections" sidebar will appear and show progress of how many rows that's been loaded. (Including errors if any)
For me it takes a few minutes to load half a mil rows. (Granted I'm on a 1GB internet connection yielding .5 GB to my box. It is a few hundred MB to download.)
Here's how it looks:
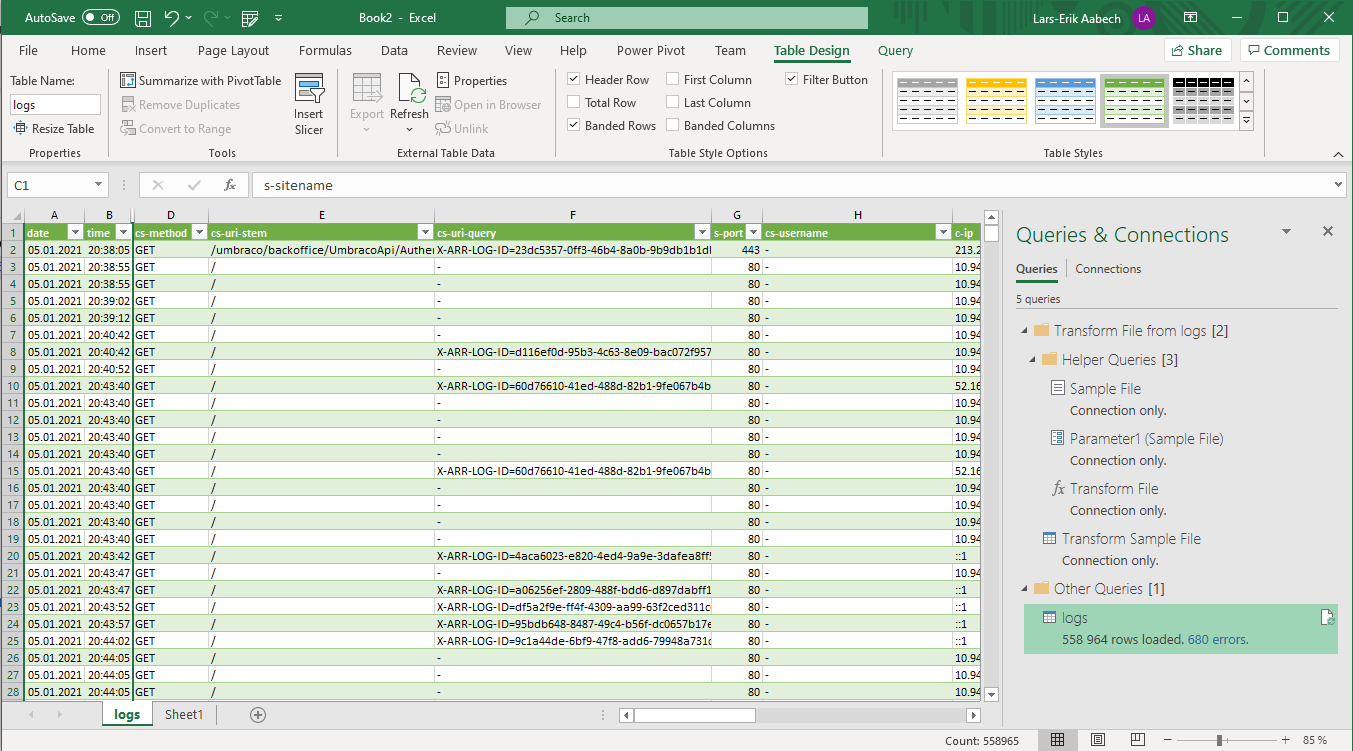
So we've got half a million log rows loaded to Excel. I can't be bothered to investigate the 680 errors, but if you click the link you'll get a special query showing those and their causes. (❤)
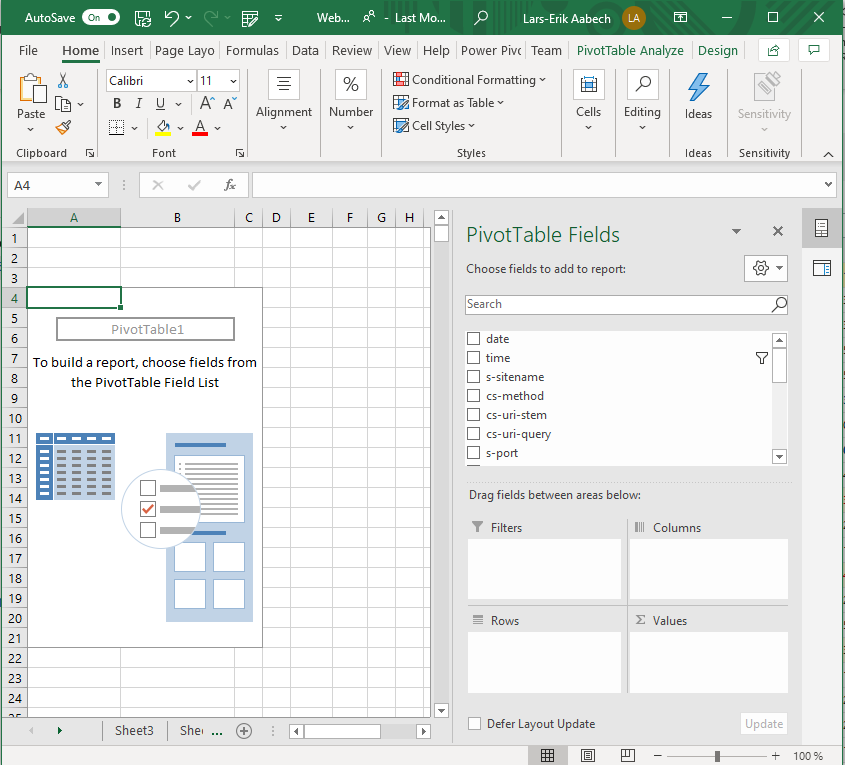
However this is fairly hard to get some value out of in its present state. We need to pivot. If you've got less than a million you can go to the "Insert" ribbon and click "Pivot table". Make sure you've selected a cell in the log table first. Just accept the default options and skip to the next section.
Pivoting more than a million rows
Incidentally pivoting is also the trick (untested) if you've got more than a million rows. You'll have to right click the "logs" query in the "Queries & Connections" toolbar on the right and select "Load to". You can then change to a "Pivot Table" instead of table and skip loading all the details. I believe there's also options to build cached data models, but that's outside of my skillset and the scope of this post as well. :)
Pivoting W3C logs
Which ever way you opt to pivot the log data you'll end up with a worksheet like this:
I've got two favorite setups for analyzing logs. First of all, I'd like to examine whether a spike is due to a new bot of some sorts. We'll just block it if it's something we're not interested in. It can save an amazing amount of processing you possibly weren't aware you spent.
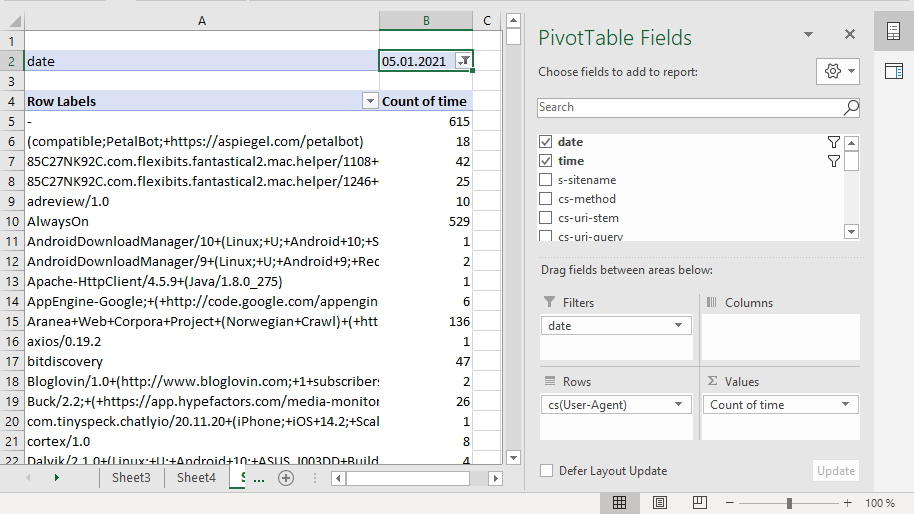
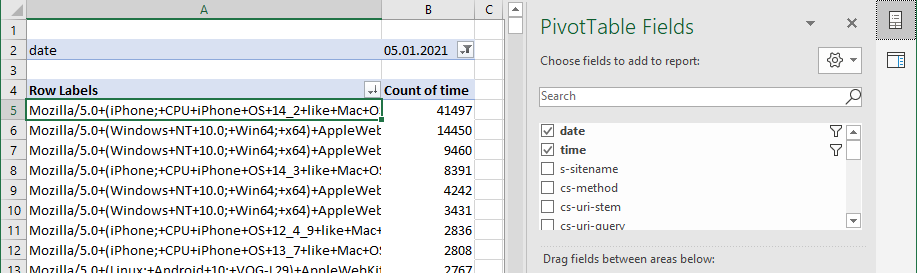
Though we imported all the log files, for this you'd likely want to look at a specific day. Dragging "date" to "Filters" lets you select a date in B2. (Full screenshot further down)
Next we want to look at agents, so we drag "cs(User-Agent)" to "Rows". (They'll all appear instantly)
Finally we want to see how many hits we've got from each agent and then sort. We can actually drag any field, but let's go with "time" for counting. The final dragging step is to drag "time" into "Values".
We should be left with something like this:
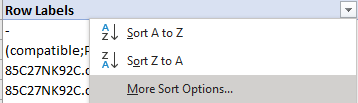
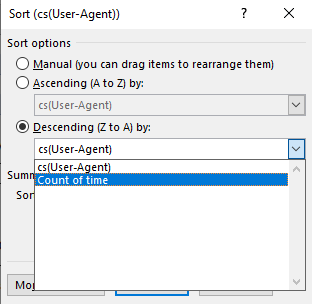
As you can see we still have quite a few agents to try to rid ourselves of, but the ones we see here have too acceptable request rates to bother. The one's we'd be interested in would have thousands in the "Count of time" column. To find them easily we have to sort, and this is were Excel can be a bit quirky. In order to sort the pivot by "Count of time" we have to open the dropdown menu on "Row Labels" and select "More Sort Options...":
What follows is a rather quirky dialog, but we're after "Descending (Z to A) by: Count of time":
We're now left with a table showing that todays winner was (bloody) iPhones!
Discovering facts
If we'd had an excessive agent, likely with "bot" in it's name, the next step would be to add "c-ip" as a secondary row dimension under "cs(User-Agent)". We could then drill down into the excessive agent and likely discover IPs to block or even report.
Today however, this process lead me to replacing "cs(User-Agent)" as my rows field with "cs-uri-stem". Repeating the sorting trick showed me that the customer obviously had had a campaign of some sorts leading to the sudden spike at three o'clock. Luckily our newly upgraded S3 plan managed to take it only dropping to 2 secs response time across 29 Umbraco sites, but I'm about to have a serious talk with this particular customer - leading to a slightly more expensive hosting fee for an individual plan. 😇
Another favourite setup of mine shows which URIs (or other interesting dimensions) have errors, redirects or excessive "access denieds".
-
Rows
- cs-uri-stem
-
Columns
- sc-status
-
Values
- time
Conclusion
Using custom tools for file based logs seems to be bygones. PowerQuery can do most popular serialization formats, and within Excel limits it's awesome combined with pivot tables. If the performance isn't good enough, the same techniques can be used with SQL Server, Analysis Services and Power BI, but I guess W3C log format parsing is unnecessary in those kinds of setups.
I find myself using PowerQuery for more and more these days, so don't be surprised if another PowerQuery post sees the light of day this year. Hope you enjoyed following along and maybe even learned something. 🤓